- Get link
- X
- Other Apps
Written by: Brandon Molyneaux
I've had a few people ask me the question "what do you use to generate your maps?" I presume a lot of people think I use GIS, but in fact I don't - I use python instead.
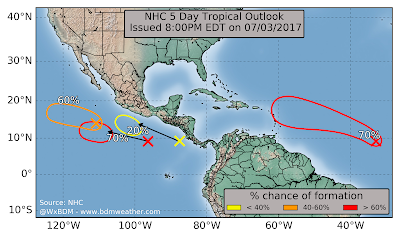
I'm going to walk you through how I generate my hurricane outlook maps (sample at the top of the post) using the data the National Hurricane Center provides. I have a "skeleton" script at the very bottom of this post, if you wish to skip straight to that. Just know that it is very bare and can be built upon. The goal of this tutorial (if that's what you wish to call it) is for you to be able to understand how the maps are created, and hopefully inspire you to create your own!
The Walkthrough Without Python Code
There are only 5 steps if you boil it down to the basics:- Declare any lists, etc. and import any packages needed;
- Retrieve the data from the National Hurricane Center, download, and save it;
- Input your latitude and longitude bounds and create the "backbone" of the map;
- Read the data, save the necessary information, and plot;
- Style as you see fit and show/save!
Simple, right? I'd be inclined to agree with you. I broke down the code very heavily below. Scroll all the way down for the entire script.
The Walkthrough With Python Code
 Step 1: Get the data.

Getting the data is fairly simple. The National Hurricane Center has these files freely available for each outlook and system. However, we should keep it simple: download this data* and save this to your desktop. These files are the files associated with the graphic to the left.
Note: the directory that all of these files are in is called sampleFile. You will need to know this for the second step.
Note: the directory that all of these files are in is called sampleFile. You will need to know this for the second step.
*The reason why I'm having you download this specific dataset is because the code provided here works with this data set. If you wish to download the most recent data, you have to edit the code as necessary to be able to read in the data correctly (which is not covered in this blog post).
Presuming you saved the files to your desktop, declare the path variable as such (with your respective operating system):
Step 2: Import any packages needed and declare the path.
The way this is setup, we don't need to declare any lists, dictionaries, etc. We just need to import a few packages, tell the program to close any existing plots, and declare your path. If you were to build upon this, you most likely need to declare a few lists and/or dictionaries. There is no need to do a pip command to install packages, since these packages come "built-in" (if you understand what pip is. If you don't understand what pip install is, don't worry much about it).
from mpl_toolkits.basemap import Basemap
import matplotlib.pyplot as plt

plt.close('all') #be sure to ALWAYS include this; closes any existing plots
path = '/Path/to_the/fileFolder' #path to the files
Be sure to leave in `plt.close('all')` if you are working with the basemap package. Otherwise, when you run and forget to "close" the map, the map will write over (literally) the previous map.Presuming you saved the files to your desktop, declare the path variable as such (with your respective operating system):
path = 'C:/Users/Public/Desktop/sampleFiles/' #if on windows
#------OR------
path = '/Users/username/Desktop/sampleFiles/' #if on mac
Step 3: Plot the map.
Now, we need to plot up the map. I haven't had much experience with Cartopy, so I'm not entirely sure if it is able to read in a shapefile the same way as Basemap does. For this script, we will be using Basemap.
m = Basemap(projection = 'merc', llcrnrlat = 2, urcrnrlat = 32,
    llcrnrlon = -142, urcrnrlon= -87,resolution='l')
m.drawcoastlines()
m.drawcountries()
m.drawstates()
If you understand basemap, this step is fairly self-explanatory. If you don't, you're declaring an object, m, with your bounding latitude/longitude, projection, and how "detailed" the map is ('l' for low, 'i' for intermediate, etc. Refer to the documentation). You're also adding in the states, countries, and coast lines.Step 4: Read in the data and plot.
When I first started working with shapefiles, I had no idea off-hand how they were structured and how to read in the information properly to work with it. Hopefully I save you a few google searches with this:outlook_name = path + 'gtwo_areas_201708171153'
outlook_info = m.readshapefile(outlook_name, 'outlook')
for info, shape in zip(m.outlook_info, m.outlook):
print info
Discussion: We need to tell the script which file to get, then read it in. We do this by declaring `outlook_info`. We don't have to declare `outlook_name`, but readability is key. The "for loop" might be a bit unusual, as there is a zip() function instead of a range() function. Essentially, the zip() function allows the for loop to execute correctly. I won't go into any further detail since it could get confusing to someone who is unfamiliar with it.
When `info` is printed, it will give you a dictionary with (what could be) a lot of information. Hopefully you know how to access a dictionary and get the information you need. If not, refer to the documentation. Do note that this is how you access any .shp file - this is not exclusive to this script.
Suppose you were to type in `print shape` instead of `print info`; this will print out a lot of coordinates, which identify the shape outline. Let's go ahead and save the probability of 5 day development and then plot it.
outlook_name = path + 'gtwo_areas_201708171153'
outlook_info = m.readshapefile(outlook_name,  'outlook')
for info, shape in zip(m.outlook_info, m.outlook):
    x, y = zip(*shape)
    probFiveDay = info['PROB5DAY']
    m.plot(x, y, color = 'orange')
This will get you the outline, but not the point. The point is very similar: we just need to go in and replace 'gtwo_areas_2017...' with 'gtwo_areas_2017...', as such:
points_path = path + 'gtwo_points_201708171153'
points_info = m.readshapefile(points_path, 'points')
for info, shape in zip(m.points_info, m.points):
    x, y = zip(shape)
    m.plot(x, y, c = 'orange', marker = 'X', ms = 9., ls = None, mew = 1, mec = 'k')
Step 5: Style and show/save
I'm not going to explain how to style, since from here you're following the same arguments as you would with a matplotlib graph. Saving and showing is the same thing as well, but I'll provide the code:
plt.savefig('latestoutlook.png')
plt.show()
The Code: The Entire Thing
Before you copy and paste, be sure you download the files that work with this code here and save it to your desktop.
And that's it! Enjoy playing around with the code! Hopefully you got something out of this and was inspired in someway. If you have any questions or comments, feel free to send me a DM/Tweet: @WxBDM. I'd love to see what you created using this tutorial!
from mpl_toolkits.basemap import Basemap
import matplotlib.pyplot as plt

plt.close('all')
path = 'C:/Users/Public/Desktop/sampleFiles/' #if on windows
#------OR------
path = '/Users/Username/Desktop/sampleFiles/' #if on mac

m = Basemap(projection = 'merc', llcrnrlat = 2, urcrnrlat = 32, llcrnrlon = -142,\
    urcrnrlon= -87,resolution='l')
m.drawcoastlines(linewidth=0.5)
m.drawcountries(linewidth=0.5)
m.drawstates(linewidth=0.5)

outlook_path = path + 'gtwo_areas_201708171153'
outlook_info = m.readshapefile(outlook_path, 'outlook')
for info, shape in zip(m.outlook_info, m.outlook):
    try:
        x, y = zip(shape)
    except ValueError:
        x, y = zip(*shape)
    probFiveDay = info['PROB5DAY']
    m.plot(x, y, color = 'orange')

points_path = path + 'gtwo_points_201708171153'
points_info = m.readshapefile(points_path, 'points')
for info, shape in zip(m.points_info, m.points):
    try:
        x, y = zip(shape)
    except ValueError:
        x, y = zip(*shape)
    m.plot(x, y, c = 'orange', marker = 'X', ms = 9., ls = None, mew = 1, mec = 'k')

plt.savefig('latestoutlook.png')
plt.show()
Comments
Post a Comment